What will define the best sustainable automation solutions in 2026? The answer will not rest on speed alone. It will depend on measurable resource savings, resilient design, and responsible deployment across the entire equipment lifecycle.
Blake Moret, former chairman and CEO of Rockwell Automation, has described sustainability as “a business imperative.” That view reflects today’s industrial reality. A smart factory may combine variable-speed drives, machine vision, predictive maintenance, and edge controllers. Together, these tools can reduce electricity use, material waste, unplanned downtime, and avoidable transport. The benefits become visible on the factory floor: cooler motors, fewer rejected parts, and production data available within seconds.
The strongest solutions should also support renewable-energy integration, circular maintenance, and transparent carbon reporting. Digital twins can test process changes before physical equipment is altered. Predictive systems can replace parts before failure, but only when their forecasts remain reliable. This distinction matters.
Not every connected machine is sustainable.
A cloud-heavy platform may increase data-center energy demand. A new robot may save labor while creating difficult repair or recycling challenges. These trade-offs require careful evaluation, not optimistic marketing. This guide will compare leading sustainable automation approaches through energy intensity, lifecycle cost, emissions visibility, interoperability, cybersecurity, and worker safety. It will also question common assumptions. Some solutions may perform brilliantly in a controlled pilot, yet disappoint under fluctuating demand, limited skills, or aging infrastructure. The best choices for 2026 will therefore be practical, measurable, and adaptable—not merely impressive on a presentation slide.
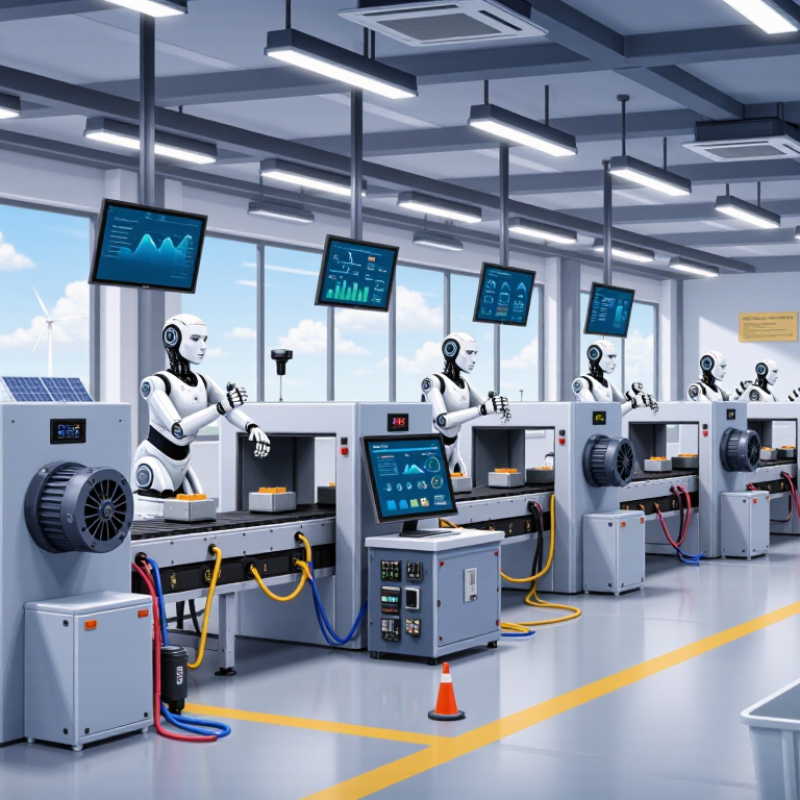
In 2026, sustainable automation means more than replacing people with machines. It means delivering useful output with less energy, material, and avoidable downtime. The International Energy Agency’s Electricity 2024 report projects data-centre electricity demand could more than double by 2026, exceeding 1,000 TWh annually. That figure exposes a hard question. Can an efficient control system remain sustainable when its computing burden keeps growing? Maybe not always.
A credible solution measures energy per completed unit, not only machine efficiency. It tracks idle power, compressed-air leaks, battery health, repair intervals, and software workload. The International Federation of Robotics reported 541,302 industrial robots were installed worldwide in 2023, according to World Robotics 2024. More automation can improve precision, yet every robot carries embodied carbon from metals, electronics, shipping, and disposal. Modular parts, open interfaces, predictive maintenance, and refurbishment therefore matter. A dark factory is not automatically a green factory.
In practice, I would test a small automation cell first. Record its baseline for four weeks. Then compare output, electricity, scrap, and worker travel. ISO 50001 principles support this measurement discipline, but certification alone cannot prove good results. Operators should pause unsafe cycles and challenge wasteful settings. Data quality is often the weak point. Sensors drift, estimates get polished, and suppliers may report incomplete lifecycle impacts. Sustainable automation should make those gaps visible, not hide them.
What Are the 2026 Best Sustainable Automation Solutions?
Sustainable automation now covers several technology types, not one universal system. Energy management platforms use sensors to adjust lighting, heating, cooling, and compressed air. The UNEP 2023 Global Status Report states that buildings consume about 32% of global energy.
A factory dashboard showing a 12% overnight energy spike can reveal a forgotten machine cycle.
Efficient robotics form another key category. Modern systems can regulate motion, reduce idle time, and recover braking energy. The International Federation of Robotics reported 541,302 industrial robot installations worldwide in 2023.
However, higher automation does not automatically mean lower emissions. A robot running continuously may consume more power than a well-planned manual process.
Engineers should measure energy per unit, not only output per hour.
That distinction is often missed.
Digital twins and predictive maintenance add a third layer. They simulate production changes before physical equipment is altered. They also detect vibration, heat, or pressure changes before failures occur.
Still, digital models depend on accurate data. Sensors drift. Reports become incomplete. Human review remains necessary, especially when equipment operates under changing loads.
Circular automation systems can sort, repair, reuse, and remanufacture components, but their results require transparent measurement rather than optimistic assumptions.
The best sustainable automation solution must prove performance, not merely display green claims. The International Energy Agency reports that industry consumes about 37% of global final energy. Therefore, measure energy before selecting equipment. Track kWh per unit, peak demand, idle consumption, and compressed-air losses. The U.S. Department of Energy estimates that compressed-air systems can waste 20–30% of their input energy. This makes leaks visible, especially near older valves and overnight production lines.
Cost evaluation needs a wider lens. Include purchase price, installation, software, maintenance, downtime, and disposal. A low-cost controller may require frequent replacement. That weakens its environmental value. Use a five-year or ten-year lifecycle model. Record productivity, repair hours, and energy savings separately. ISO 50001 guidance supports continual energy-performance measurement, but measurements can still be incomplete. I would question any result without a clear baseline, seasonal data, and independent verification. Carbon calculations should include electricity sources, materials, transport, and end-of-life treatment.
Tips: Start with one measurable production cell. Install temporary meters for four weeks. Compare normal shifts with idle periods. Ask suppliers for repairability data, expected service life, and software support terms. Avoid confusing fewer workers with sustainability. The better signal is lower energy per finished unit, with stable quality and less waste. Review the figures quarterly. Imperfect data is common, but undocumented assumptions should never remain invisible.
| Automation solution | Primary application | Typical energy reduction | Typical operating-cost reduction | Indicative payback period | Operational CO₂e reduction | Environmental performance indicators | Evaluation priority |
|---|---|---|---|---|---|---|---|
| Occupancy-based HVAC and lighting controls | Commercial buildings, warehouses, schools, and mixed-use facilities | 10–25% of combined HVAC and lighting energy | 8–20% | 1–4 years | 10–25% of related operational emissions | Reduced electricity use, lower peak demand, improved thermal comfort, and reduced after-hours consumption | Verify occupancy sensors, control sequences, commissioning quality, and cybersecurity |
| Variable-speed drive automation | Fans, pumps, conveyors, compressors, and other variable-load motor systems | 15–35% of motor-system electricity | 10–30% | 1–3 years | 15–35% of related electricity emissions | Lower electricity demand, reduced mechanical stress, longer equipment life, and lower noise | Assess load profile, minimum operating speed, motor compatibility, harmonics, and maintenance requirements |
| Automated compressed-air monitoring and leak management | Manufacturing plants and facilities using pneumatic equipment | 10–30% of compressed-air energy | 8–25% | 0.5–2 years | 10–30% of related electricity emissions | Lower compressor runtime, reduced pressure losses, fewer unnecessary repairs, and lower noise exposure | Measure leakage rate, system pressure, unloaded runtime, compressor sequencing, and sensor accuracy |
| Automated heat recovery and process-temperature control | Industrial processes, ventilation systems, data centers, and large commercial buildings | 10–25% of related thermal energy | 8–22% | 2–5 years | 10–25% of related fuel or electricity emissions | Lower fuel consumption, reduced waste heat, lower refrigerant or boiler demand, and improved process stability | Check temperature approach, heat-exchanger fouling, control stability, safety interlocks, and recovered-heat utilization |
| AI-assisted energy management and demand optimization | Multi-system facilities with interval meters, building-management systems, or industrial energy loads | 5–15% of whole-facility energy | 5–15%; peak-demand savings may add 3–12% | 1–3 years | 5–15% of facility operational emissions | Lower peak demand, improved renewable-energy matching, reduced curtailment, and better load transparency | Require interval-meter validation, explainable recommendations, human override, data governance, and cybersecurity controls |
| Predictive maintenance for motor-driven assets | Pumps, fans, compressors, production lines, and rotating equipment | 5–15% of affected asset energy | 10–20% maintenance cost; 5–15% downtime reduction | 1–3 years | 5–15% of affected asset emissions | Longer asset life, fewer replacement parts, lower scrap, and reduced emergency maintenance travel | Measure false alarms, avoided failures, sensor lifespan, data quality, and maintenance-work-order outcomes |
| Automated material-flow and route optimization | Warehouses, distribution centers, internal logistics, and electric vehicle fleets | 10–25% of material-handling or fleet energy | 8–20% | 2–5 years | 10–25% of related operational emissions | Fewer empty movements, reduced idle time, lower battery degradation, and less packaging or product damage | Evaluate travel distance, utilization rate, charging efficiency, battery replacement, safety, and system scalability |
Selecting a sustainable automation solution in 2026 starts with a measurable problem, not an impressive feature list. Map the current workflow, energy use, material waste, and staff hours. Record one normal week. Include delays, manual errors, and rejected outputs. Start with evidence.
Define success using practical targets, such as lower electricity use per task, fewer discarded materials, or safer working conditions. Ask suppliers for lifecycle data, maintenance requirements, software update policies, and repair options. Check whether their figures use consistent measurement methods. Independent audits matter, but they may not cover every operating condition.
Test the solution in a limited area before expanding it. Use the same baseline period and compare actual results after thirty days. Let operators inspect the controls and report awkward steps. Their experience often reveals hidden waste. Train staff before launch, then review performance monthly. Keep a fallback process for outages and unexpected results. A pilot may expose weak assumptions. That is useful.
Implementation also needs clear ownership. Assign one person to track energy data, one to manage safety checks, and one to document changes. Review supplier claims against utility bills, maintenance records, and production logs. If savings appear only in a presentation, investigate further. Sustainable automation should reduce environmental impact without creating expensive, short-lived equipment. Some projects will need adjustment. Accepting that early protects both budgets and credibility.
In 2026, the best sustainable automation solutions should prove more than fast output. Measure their impact across energy, materials, maintenance, people, and cash. Start with a twelve-week baseline before changing the process. Record electricity per unit, scrap weight, downtime minutes, and service visits. Use meter readings, production logs, and dated maintenance records. This evidence feels less impressive than a glossy efficiency claim. It is usually more useful.
Long-term performance needs a fixed review rhythm. Compare monthly results with the baseline, then examine seasonal demand. A machine may use less power while creating more rejected parts. That trade-off can erase the environmental benefit. Track energy per accepted unit, not energy per operating hour. Also calculate total ownership costs over three to five years. Include training, software updates, spare parts, disposal, and lost production. Financial payback matters, but resilience matters too. Can the system recover after a sensor failure? Can technicians understand its alerts without guessing?
Reliable evaluation includes worker feedback and independent checks. Ask operators whether automation reduces strain or moves pressure elsewhere. Review noise, repetitive motion, access risks, and training time. Keep an audit trail for every reported result. Early data will contain gaps. Some targets will fail. That is normal, but hiding weaknesses damages trust. Set improvement targets, document exceptions, and revise assumptions when evidence changes. Measure the quiet costs, especially those that appear after the first year.